Features
Gallery 1
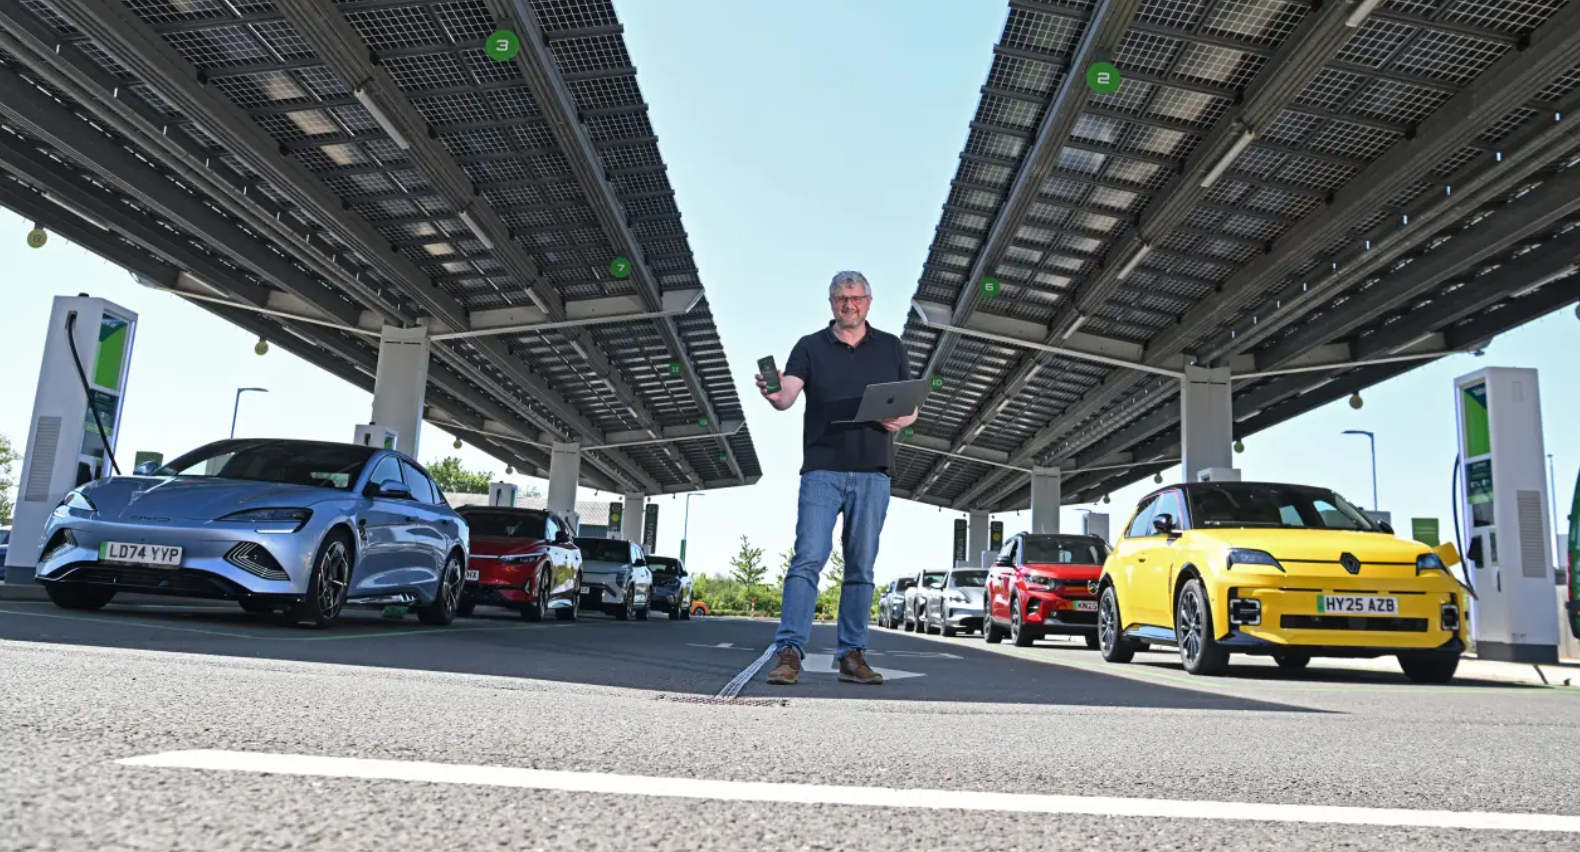
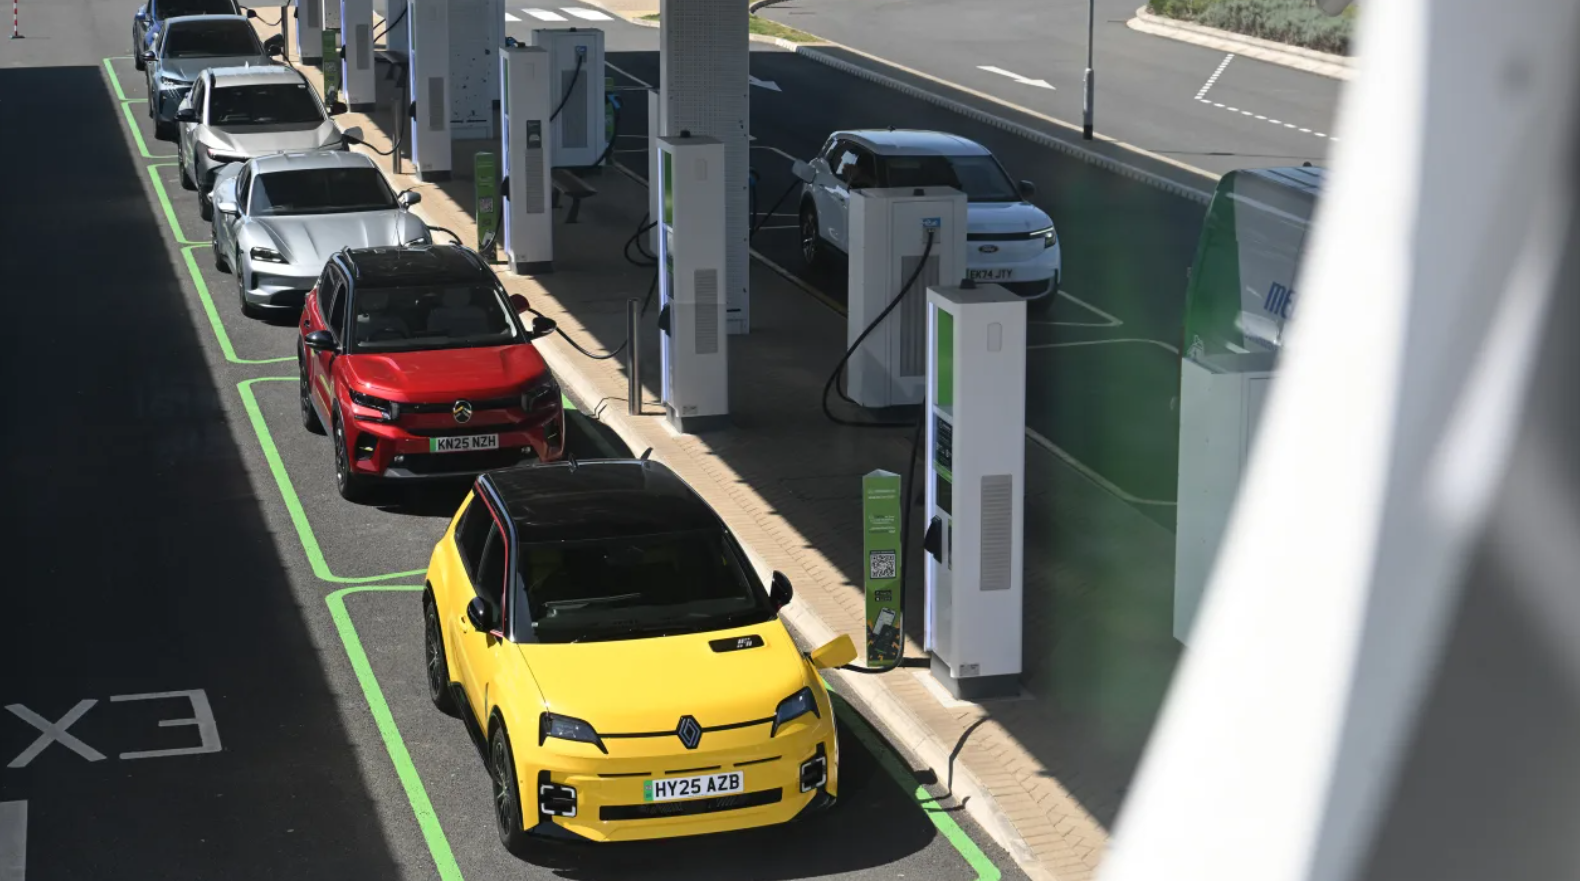
For many electric vehicle drivers, charging is the most frustrating part of ownership. You plug into an ultra-rapid DC charger expecting the maximum advertised rate – yet the car rarely sustains it, and topping up from 20 per cent to 80 per cent often takes longer than the claimed half-hour.
The easy assumption is to blame the charger, but some charging infrastructure operators insists that’s not always true. To put this to the test, UK’s Auto Express took 10 EVs to the Braintree charging hub of Gridserve, a UK charge point operator, to compare real-world performance against the marketing promises. And while some of these specific these models are not available in Australia, the test remains an interesting exercise in how brands are progressing with EV charging technology.
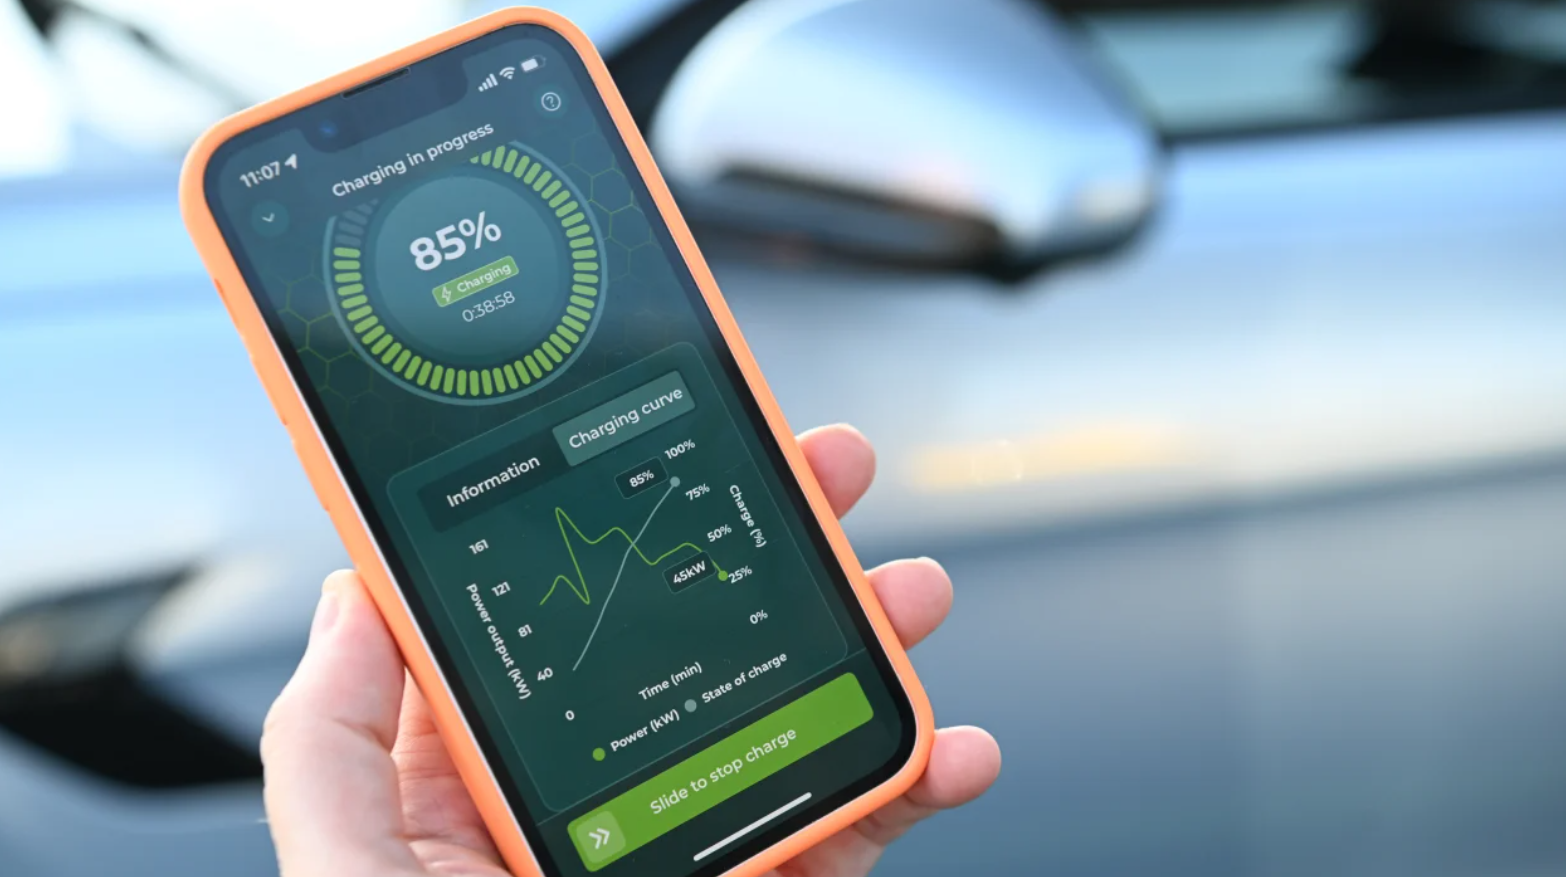
Gridserve’s Technical Director Pete Bishop analysed each car’s charging curve, assessing not only peak speed but also how consistently that speed was maintained.
1
How charging behaviour works
Battery temperature is key. Most EVs prefer charging between 20°C and 30°C, but heat from electrical resistance can force the system to slow the flow to avoid damage. Once the battery reaches a high state of charge, the car’s software steps in to progressively limit power. Sophisticated “continuously variable” systems make small, constant adjustments, while simpler “look-up table” systems cut power in set steps.
To ensure fairness, all cars were tested in 13–14°C ambient conditions without pre-conditioning. Each was charged from a similar starting point, measuring the time to add 60 per cent capacity and the rate from 80–100 per cent. Every car used its own 350kW-capable charger, ensuring the car itself – not the hardware – determined the outcome.
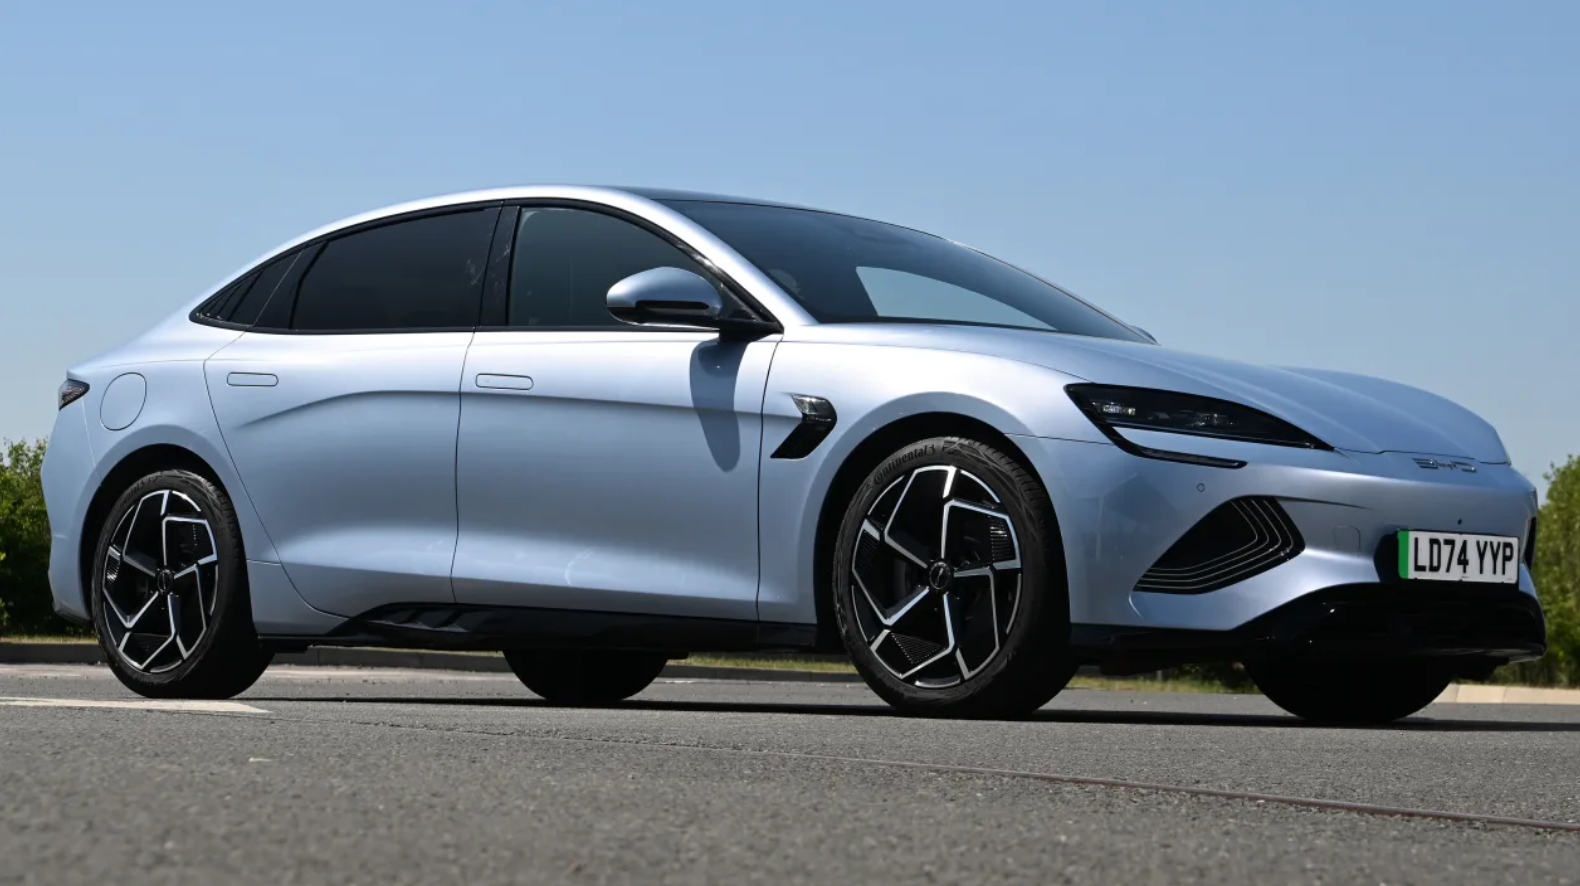
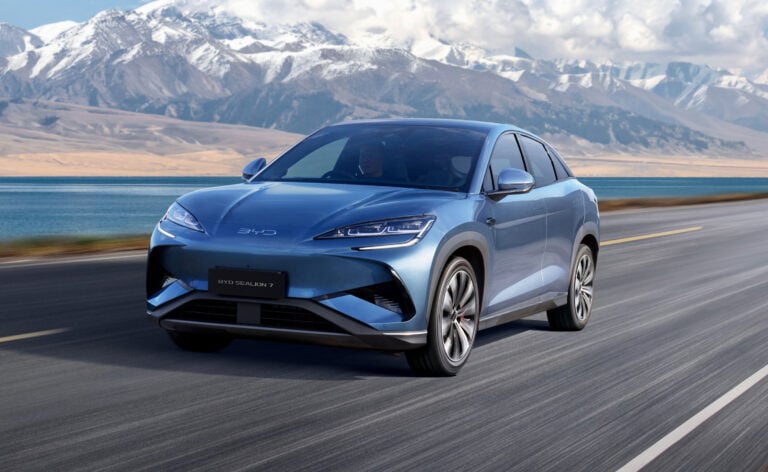
BYD Seal
1
Test results:
Battery size: 82.5kWh
Claimed peak: 150kW
Peak achieved/duration: 123kW / 5 min
60% top-up: 32 min
Average to 80%: 104kW
Time to reach 80–100%: 56 min (99%)
After a hesitant start, the Seal settled above 120kW for much of the first phase, then saw a sharp step down after 60 per cent charge. Charging slowed to under 50kW by 85 per cent, taking nearly an hour to complete the final stretch – and stopping shy of full at 99 per cent.
Phases:
- Brief spike, then drop as the cold battery adjusted.
- Held maximum for five minutes, strong rate to 60 per cent.
- Steep drop-off post-60 per cent due to programmed limits.
- Very slow final phase, long time from 80–99 per cent.
Expert’s view:
“The staircasing you see on the BYD’s graph is indicative of a simple, look-up table algorithm*. After a slightly erratic start, it appears very contained after that, maintaining a consistent rate of charge until it throttles back down after presumably reaching the pre-programmed temperature limit.”
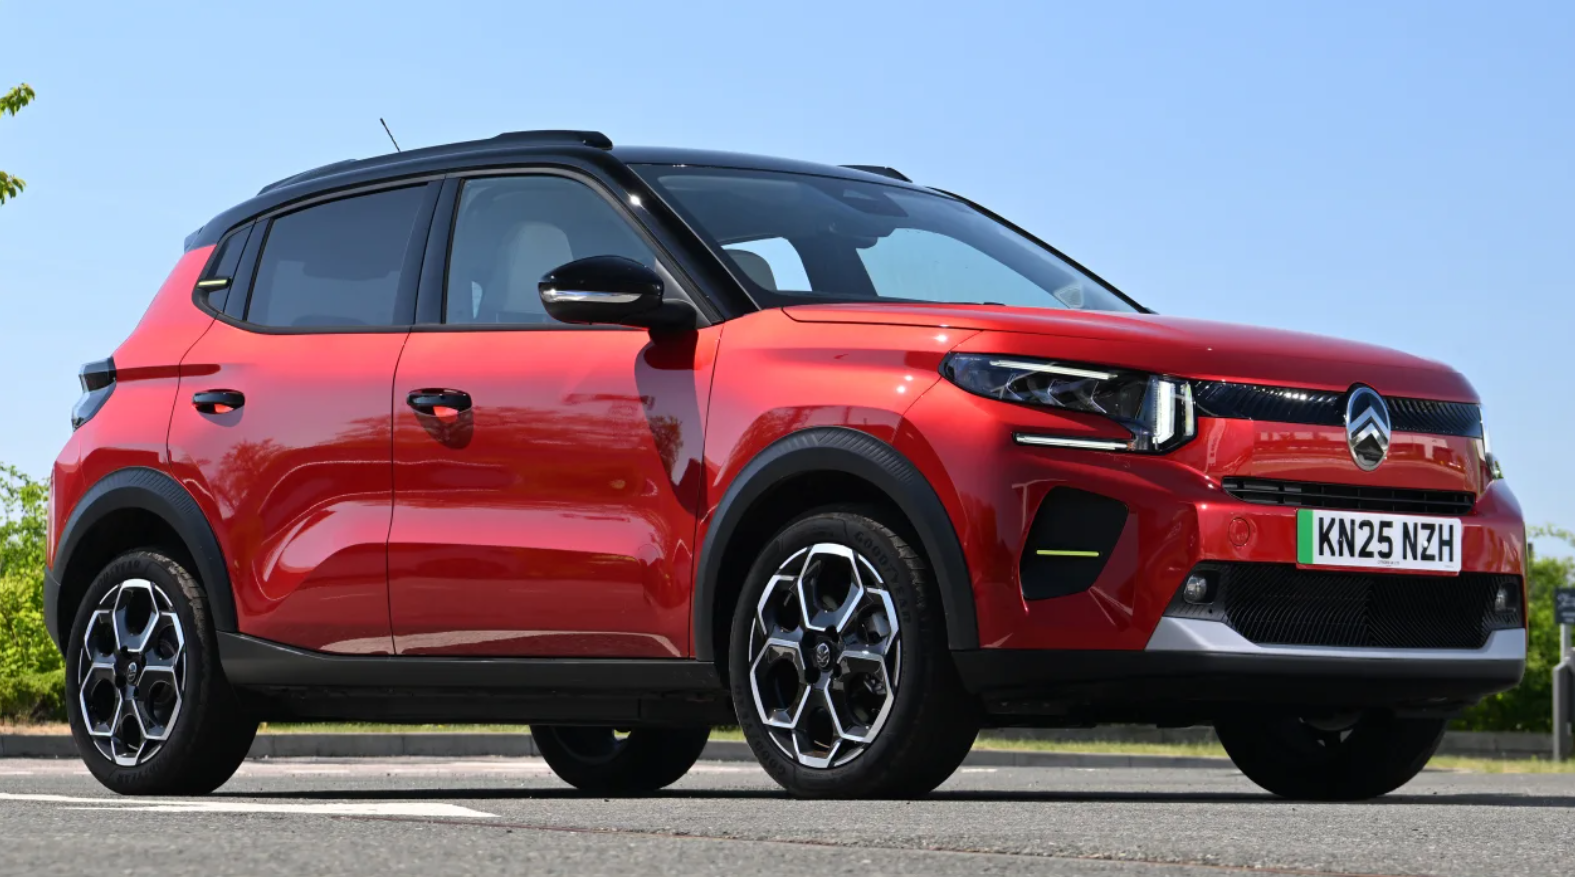
Citroën e-C3
2
Test results:
Battery: 44kWh
Claimed peak: 100kW
Peak/duration: 69kW / 3 min
60% top-up: 34 min
Average to 80%: 57kW
Time to reach 80–100%: 47 min
The e-C3’s basic management system took its time ramping up and never neared its advertised rate. Step-by-step reductions meant it overshot its claimed 20–80 per cent time by 10 minutes. The last 10 per cent was painfully slow, delivering little more than home-wallbox speeds.
Phases:
- Small spike then drop before gradual climb.
- Hit 69kW peak for just three minutes.
- Stepped descent to a plateau at 90 per cent.
- Final 20 per cent crawled at ~8.5kW.
1
Expert’s view:
“Like the BYD, the Citroen uses a look-up table algorithm for its battery management system, with very clean steps. This example is definitely in the simple category – a cheaper car can mean a cheaper system. It only maintains its maximum charge for a couple of minutes, but the aim is the best performance possible for the lowest cost.”
Ford Capri

2
Test results:
Battery: 79kWh
Claimed peak: 187kW
Peak/duration: 187kW / 2 min
60% top-up: 20 min
Average to 80%: 154kW
Time to reach 80–100%: 15 min
The Capri emerged as one of the strongest performers, thanks to its VW-developed continuously variable management system. It hit the official peak rate immediately and held above it for eight minutes before a gentle decline. Ultra-rapid speeds lasted until roughly 70 per cent capacity, and even the final top-up phase remained impressively quick.
Phases:
- Rapid ramp to peak, matching (and slightly exceeding) Ford’s claim.
- Sustained high output for eight minutes before tapering.
- Smooth curve downward as thermal limits came into play.
- Fast final stretch — 80–100 per cent in just 15 minutes.
Expert’s view:
“The charge curve of the Ford indicates a sophisticated system that’s constantly trying to optimise the charge performance against thermal limits. It’s encouraging that the Capri hit its claimed charging rate for a decent amount of time, while maintaining a reasonable power all the way through the rest of the cycle.”
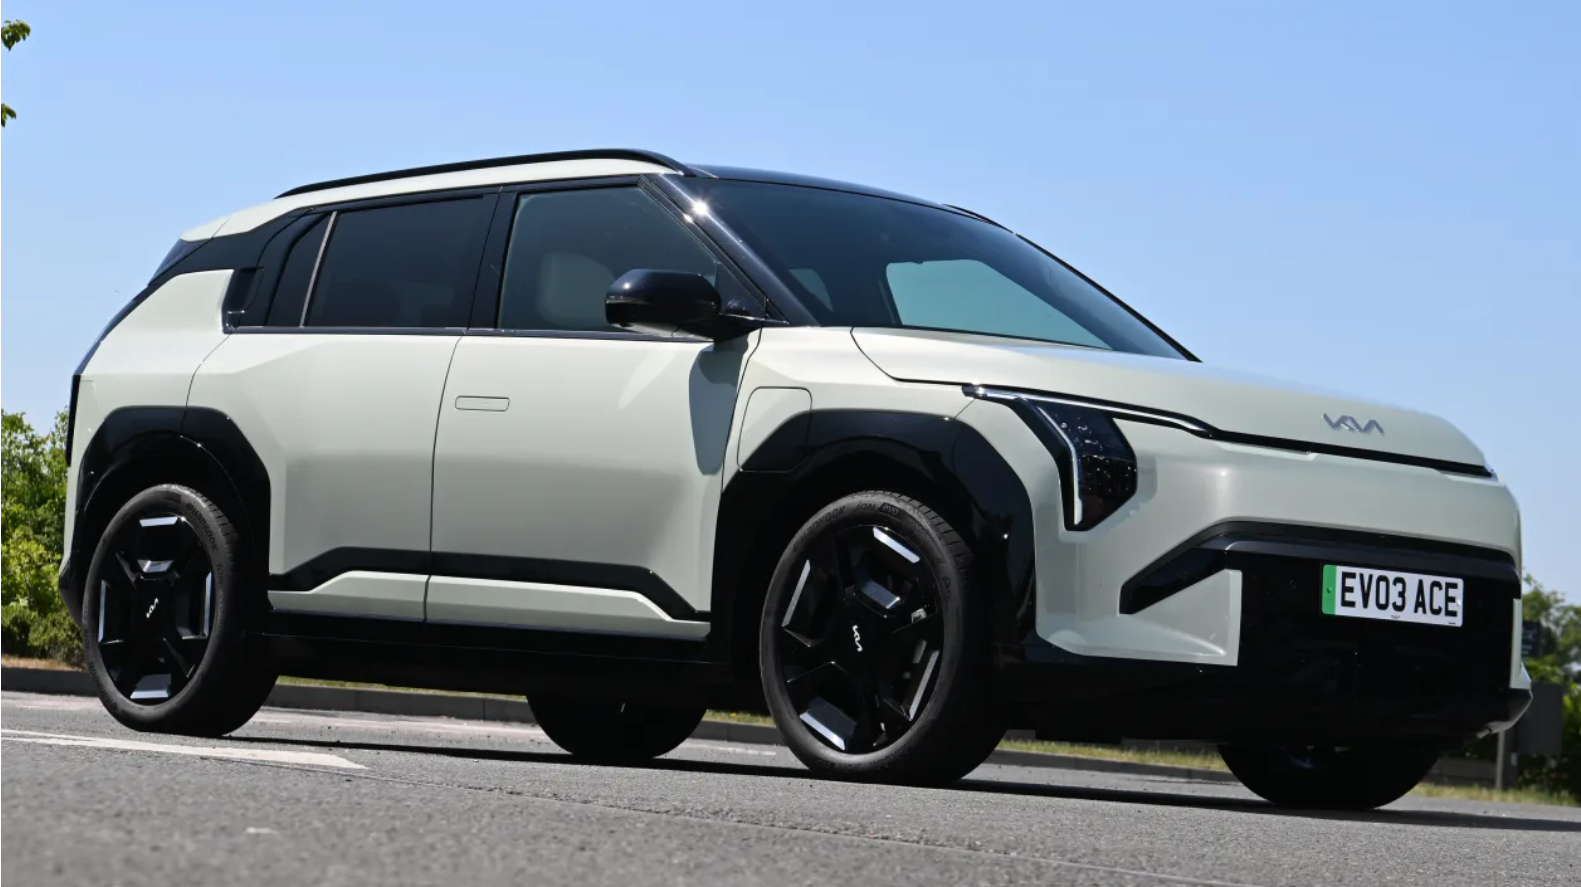
Kia EV3
1
Test results:
Battery: 78kWh
Claimed peak: 135kW
Peak/duration: 128kW / 2 min
60% top-up: 27 min
Average to 80%: 117kW
Time to reach 80–100%: 28 min
Kia’s EV3 is clearly engineered for quick “splash-and-dash” stops. It hit near-peak speeds almost instantly and held them for around 20 minutes – enough to add 50 per cent capacity. Once past 70 per cent, rates dropped sharply before flattening out for a steady but slower run to full.
Phases:
- Quick climb to 128kW – just shy of the claim.
- Strong, sustained delivery optimised for short stops.
- Sharp drop past 70 per cent, likely voltage/thermal limit.
- Gentle decline to 30kW, then a crawl to finish.
Expert’s view:
“The Kia EV3 is an interesting example of how the manufacturer has optimised the system for getting as much power into the battery as quickly as possible, but at the expense of a longer experience. It eventually hits the thermal limit and slows charging, with a graceful decline that ends at around 85 per cent.”
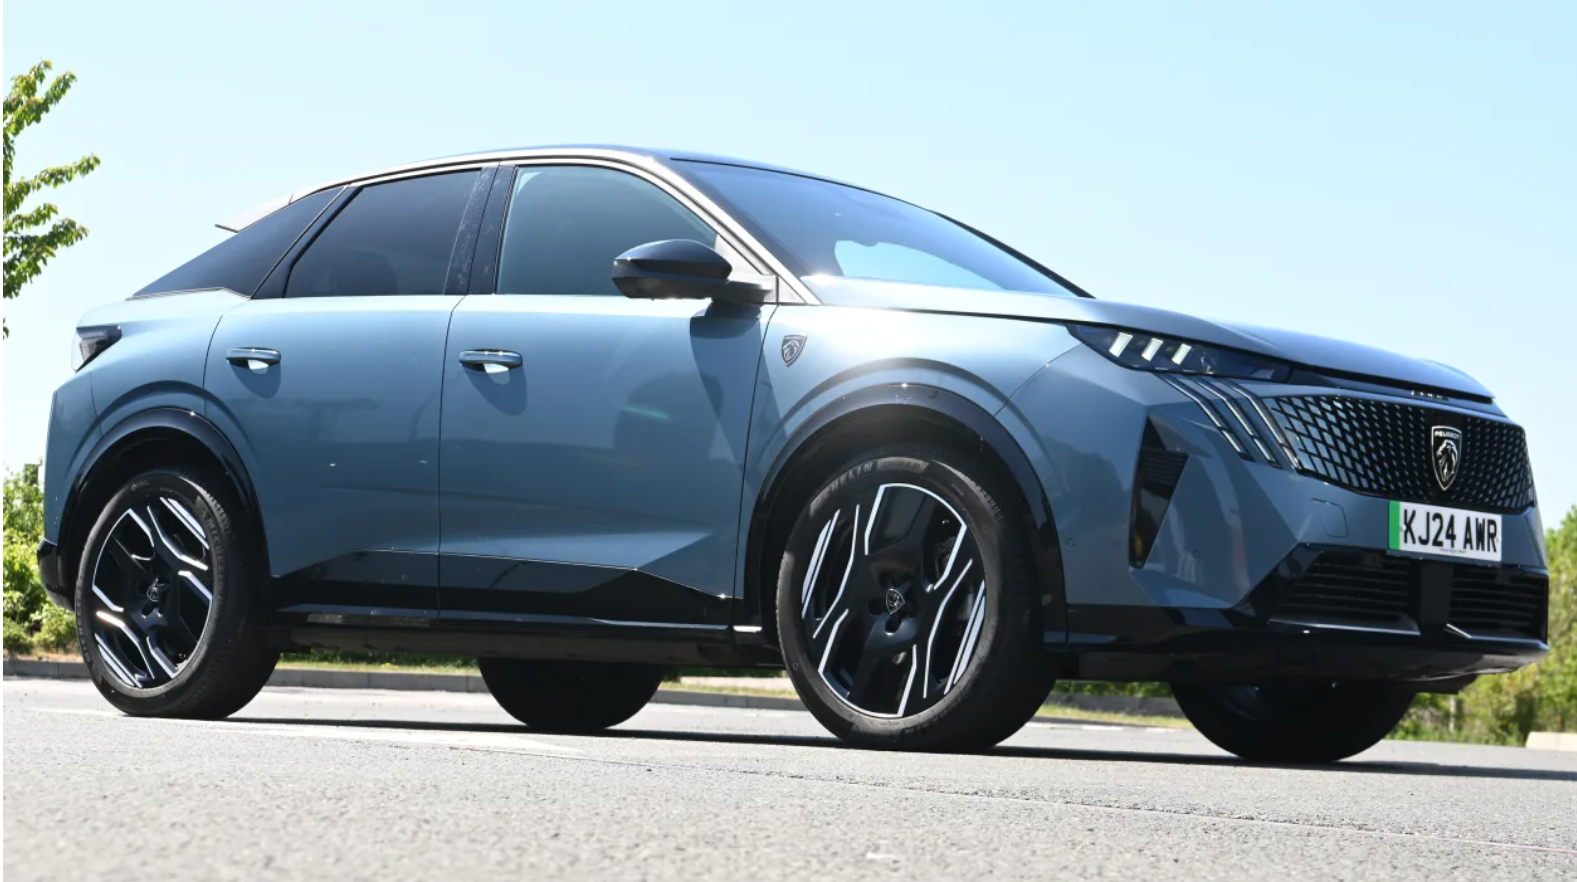
Peugeot E-3008
2
Test results:
Battery: 73kWh
Claimed peak: 130kW
Peak/duration: 123kW / 3 min
60% top-up: 38 min
Average to 80%: 86kW
Time to reach 80–100%: 74 min
The E-3008 was one of the slower chargers. It took over 10 minutes to hit its peak – already below Peugeot’s figure – and began stepping down almost immediately. The staircasing continued, with speeds dropping below 50kW before the 80 per cent mark and falling to near home-charger levels by 100 per cent.
Phases:
- Gradual rise to 123kW, well off the claim.
- Maintained decent speed briefly before a 30kW drop.
- Fast staircasing down to ~50kW by 73 per cent.
- Long, slow tail — 80–100 per cent took more than an hour.
Expert’s view:
“After ramping up, the Peugeot drops off a cliff after nearly no time at all. It didn’t get that near the maximum rate, so it sounds like Peugeot is either overstating what it can do, or it gets there under such optimised laboratory conditions, that – as an owner – you’re never going to see in the real world.”
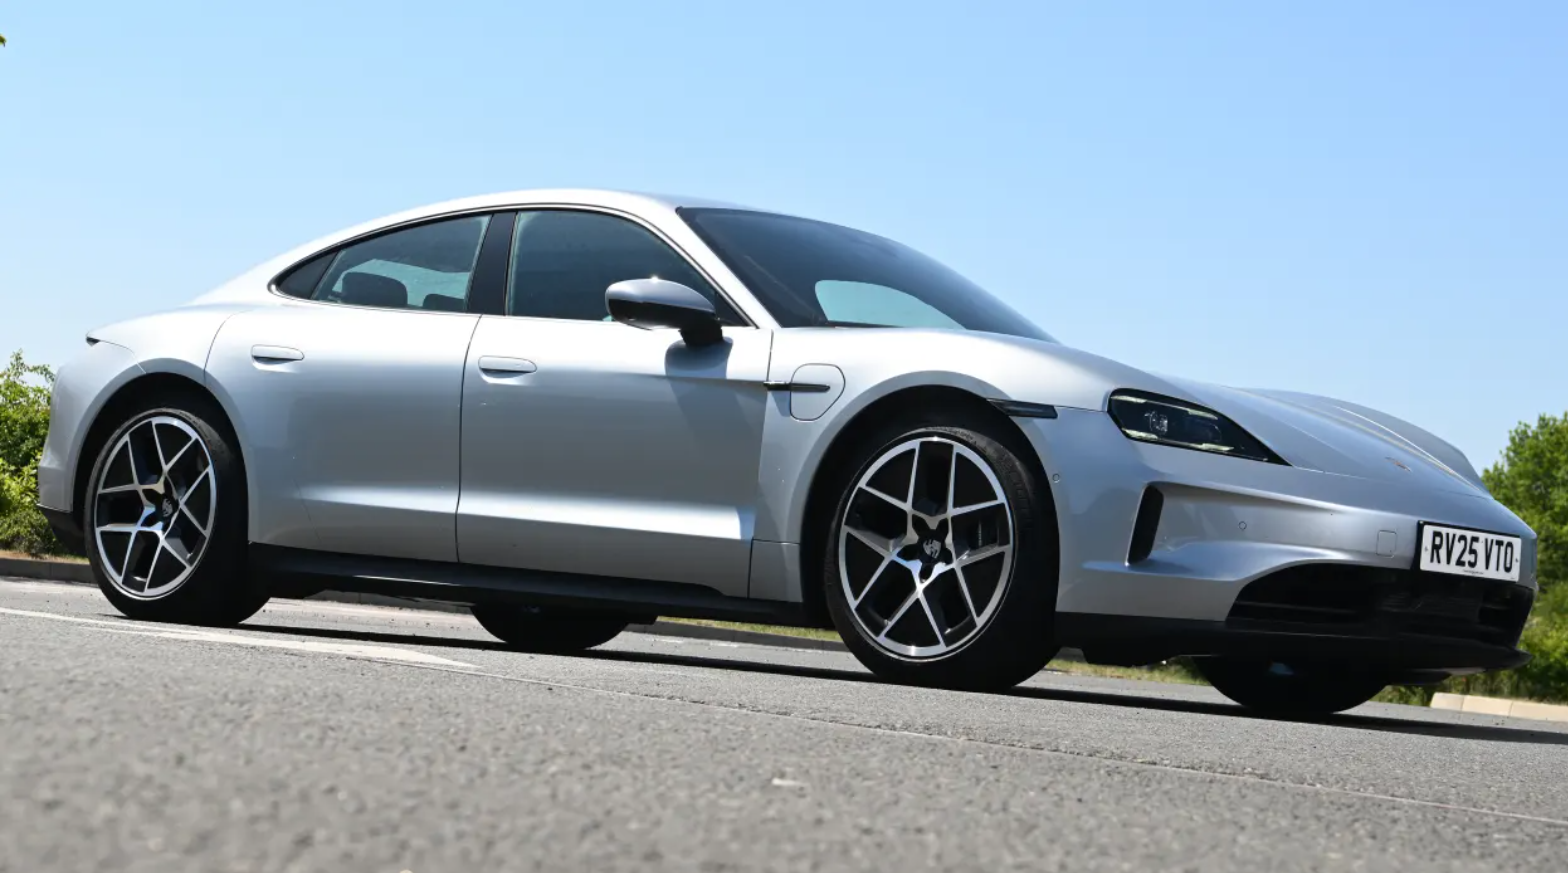
Porsche Taycan
3
Test results:
Battery: 97kWh
Claimed peak: 320kW
Peak/duration: 282kW / 3 min
60% top-up: 15 min
Average to 80%: 243kW
Time to reach 80–100%: N/A (stopped at 93%)
The Taycan demonstrated why Porsche is known for engineering. Despite falling short of the claimed 320kW, it maintained very high rates for much of the session, adding 60 per cent in just 15 minutes. A battery isolation fault ended the test at 93 per cent, but the performance up to that point was class-leading.
Phases:
- Instant ramp to 282kW, ~40kW shy of claim.
- Held ~250kW for 10 minutes for rapid replenishment.
- Gradual fall-off only after 80 per cent.
- Test ended early due to system fault at 93 per cent.
Expert’s view:
“The Porsche is another good example of how to optimise a car to take as much charge as possible in a short space of time. It’s almost straight in, holds a high level for a long time then doesn’t go off a cliff. The Taycan constantly tries to do the best it can with the constraints of battery temperature and state of charge.”
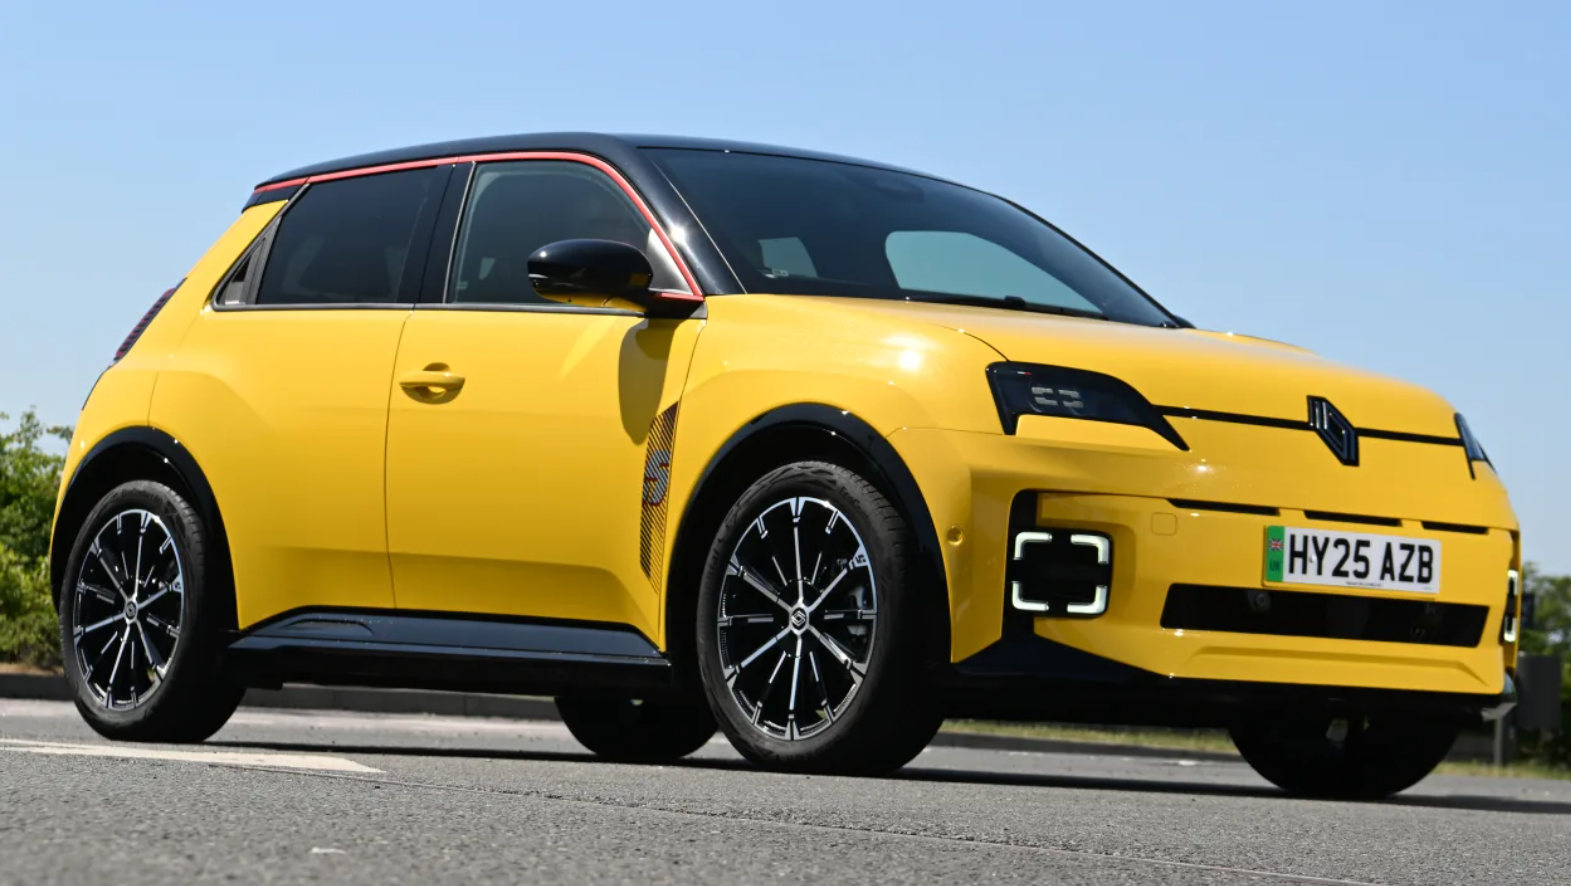
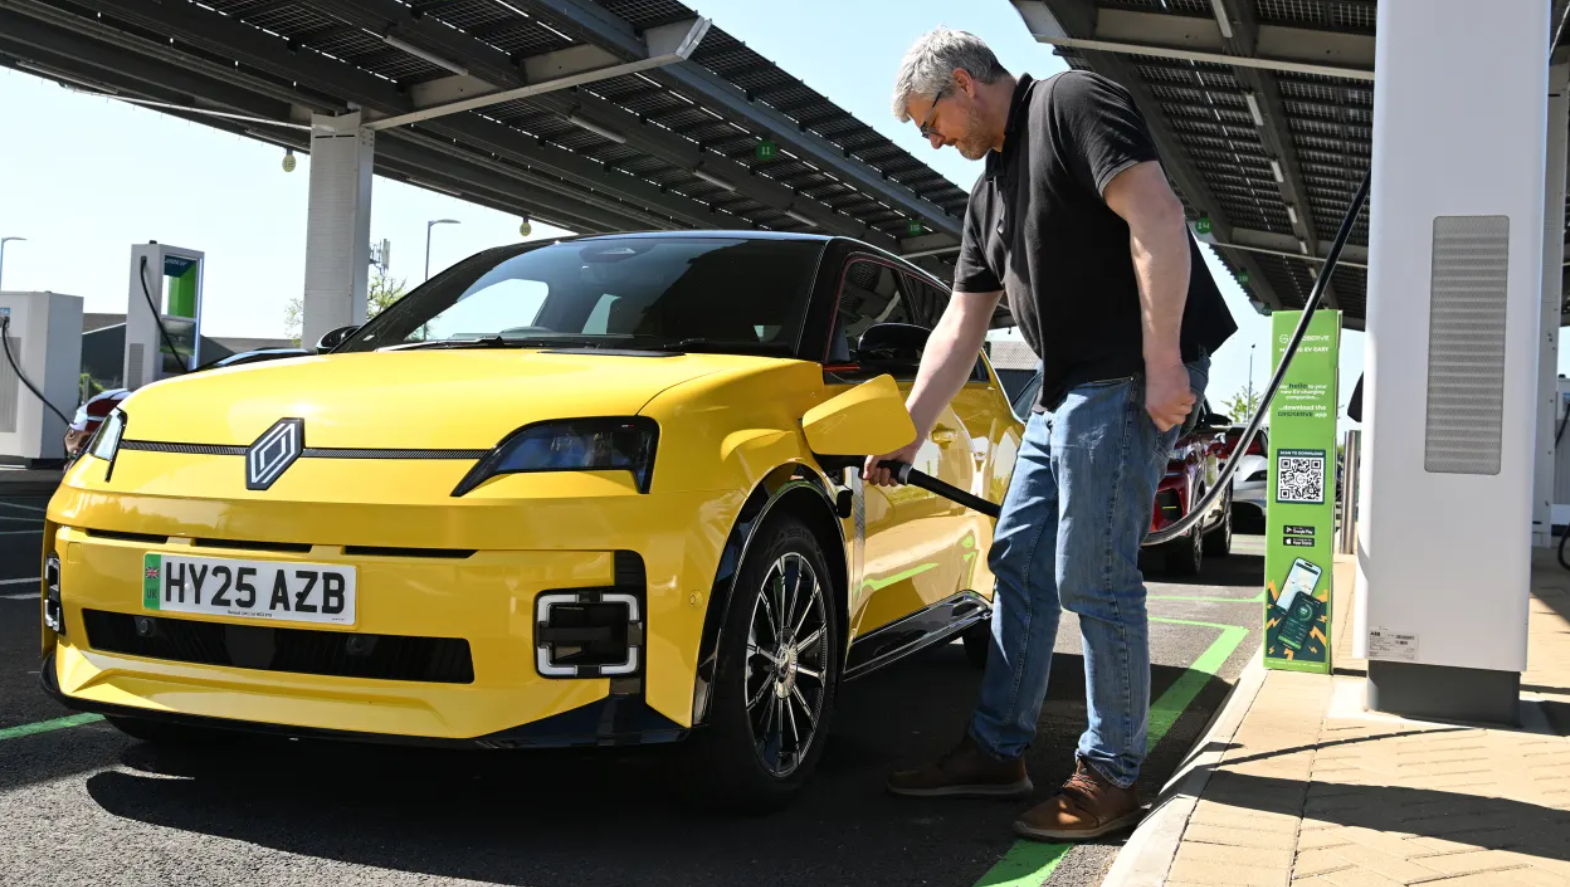
Renault 5
2
Test results:
Battery: 52kWh
Claimed peak: 100kW
Peak/duration: 87kW / 2 min
60% top-up: 26 min
Average to 80%: 65kW
Time to reach 80–100%: 34 min
Renault’s retro-inspired EV shares an affordable price point with the Citroën e-C3 but delivers a more sophisticated charging profile. It took 10 minutes to reach its peak – still below claim – and switched to a stepped approach at high capacities to protect battery health.
Phases:
- Overshot, then dipped before a slow climb.
- Reached 87kW, higher than Citroën’s effort.
- Shallow decline maintained decent speeds to 80 per cent.
- Switched to step-down pattern from 90 per cent onwards.
Expert’s view:
“The Renault may be an inexpensive EV like the Citroen, but it’s doing a better job in its battery management – although, it doesn’t sustain power for long. It doesn’t quite reach maximum power, but it does have a long, shallow curve after its peak. After this, it goes from a variable rate to a standard staircase output.”
Tesla Model Y
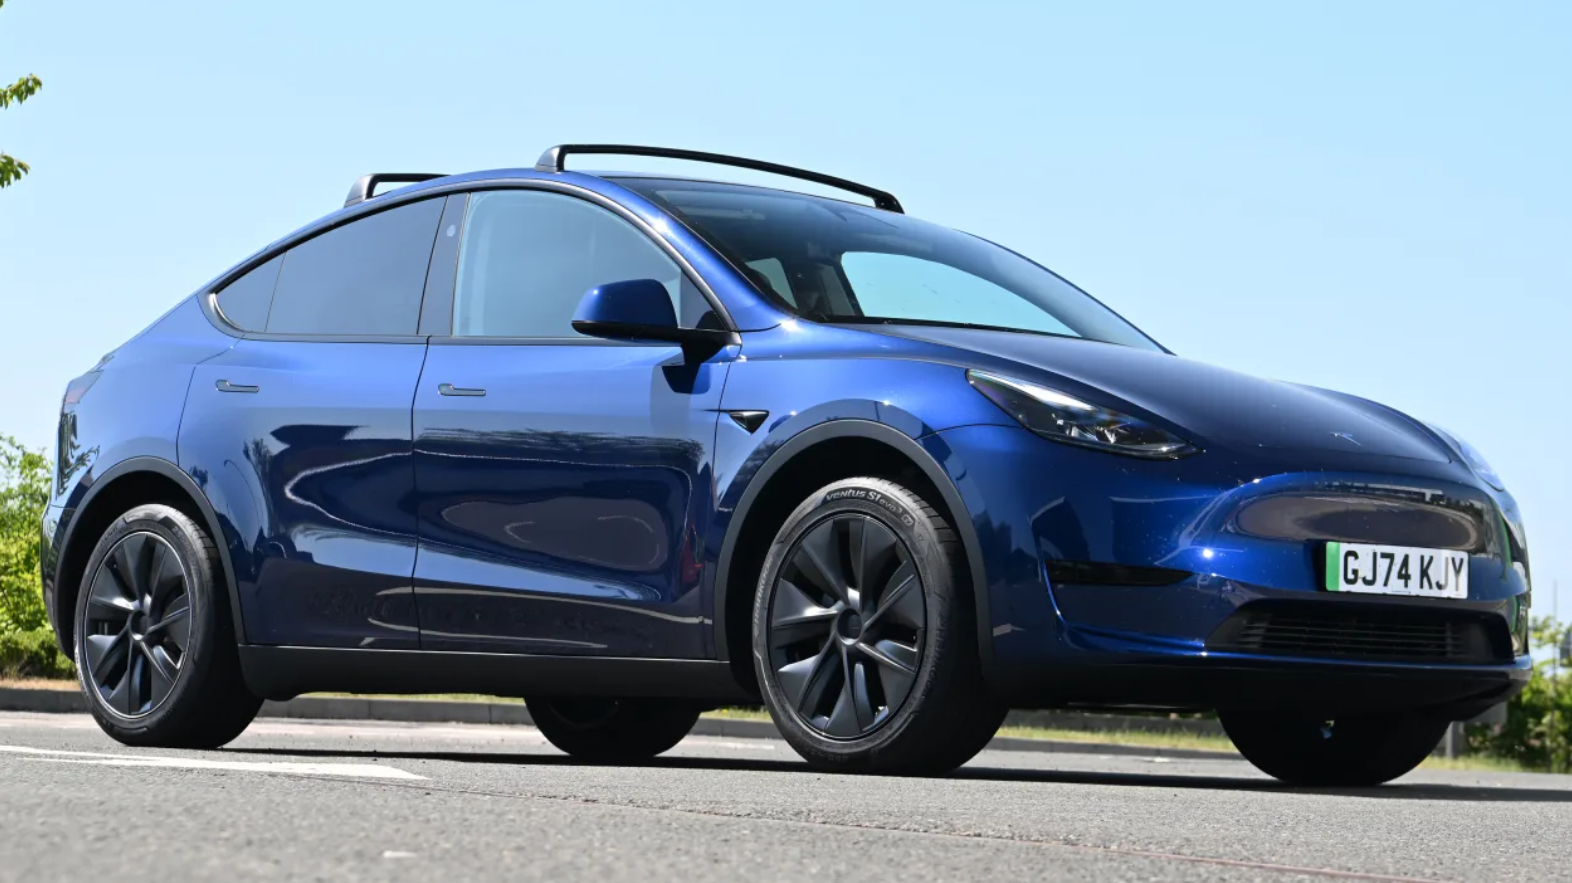
2
Test results:
Battery: 75kWh
Claimed peak: 250kW
Peak/duration: 145kW / 1 min
60% top-up: 30 min
Average to 80%: 103kW
Time to reach 80–100%: 63 min (99%)
Tesla’s long-standing experience in EVs didn’t prevent a disappointing showing. Without pre-conditioning (applied equally to all cars), the Model Y fell well short of its 250kW claim and throttled back early. The final top-up phase was notably slow.
Phases:
- Fast ramp to 145kW, over 100kW below claim.
- Continuously variable system tapered early.
- 20–80 per cent took longer than Tesla’s own estimate.
- Crawled from 80–99 per cent over an hour.
Expert’s view:
“Tesla has been in the game a long time and has a pretty sophisticated battery management system, so its cars tend to reach peak power quickly – although this didn’t get close, nor hold it for very long. Otherwise, it’s well controlled and it’s clear with Tesla’s battery longevity that it’s doing well at remaining in a safe operating area.”
Toyota bZ4X
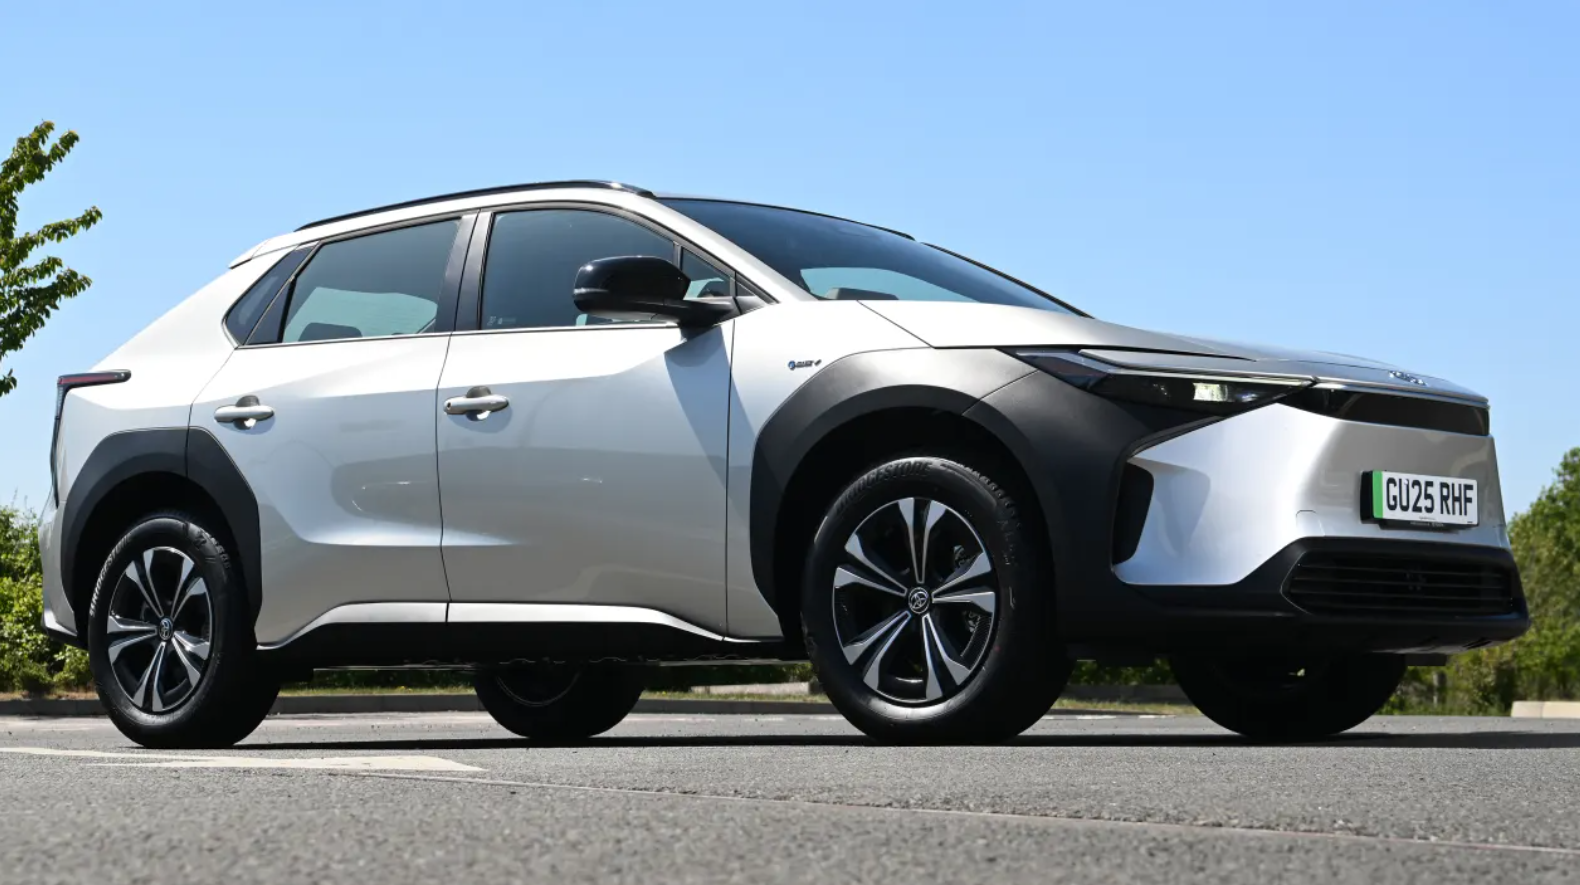
1
Test results:
Battery: 64kWh
Claimed peak: 150kW
Peak/duration: 147kW / 1 min
60% top-up: 26 min
Average to 80%: 96kW
Time to reach 80–100%: 29 min
Toyota’s first serious EV contender delivered a steady, if unspectacular, performance. It reached near-peak quickly, but the rate fell under 100kW within minutes. The last 5 per cent took over 12 minutes to complete.
Phases:
- Smooth climb to 147kW, close to claim.
- Sharp decline below 100kW after five minutes.
- Further drop to 50kW past 60 per cent added.
- Slow final 5 per cent, extended by step-down behaviour.
Expert’s view:
“The Toyota is very well controlled; it doesn’t staircase up and is updating its charge current every few seconds to get the best it can. However, look how short a time it spends at its peak – it does get pretty close to the claimed peak rate, but probably wouldn’t have stayed for much longer, even if pre-conditioned.”
Volkswagen ID.7
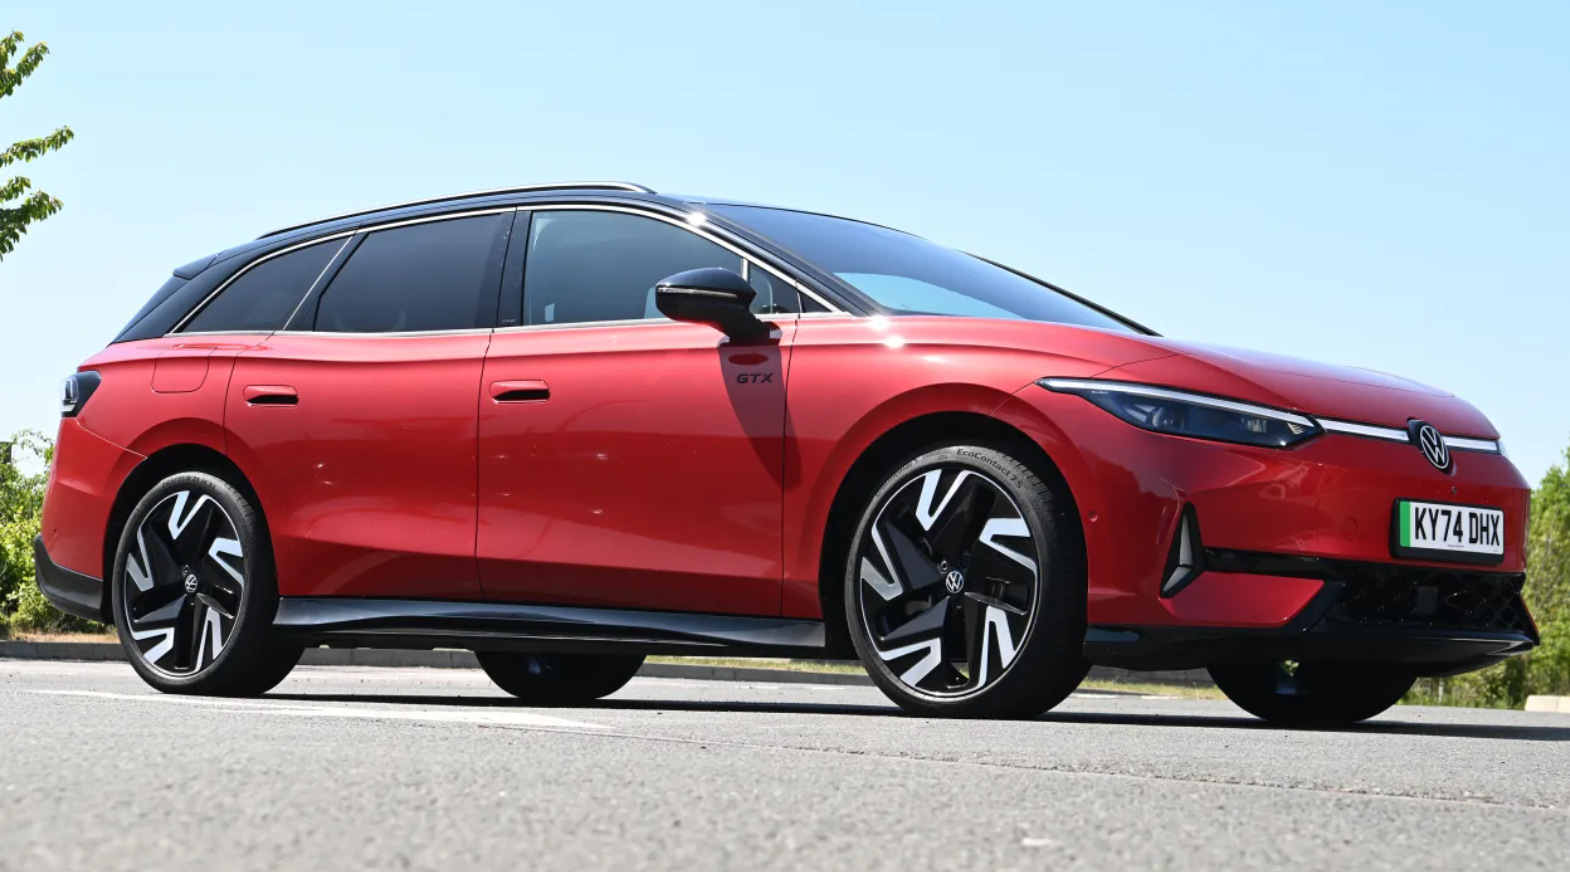
1
Test results:
Battery: 86kWh
Claimed peak: 200kW
Peak/duration: 200kW / 3 min
60% top-up: 21 min
Average to 80%: 156kW
Time to reach 80–100%: 16 min
Built on VW’s MEB platform like the Ford Capri, the ID.7 matched its sibling’s strong charging performance. It hit its claimed peak and held it before a gradual, controlled decline, staying above 100kW until 76 per cent.
Phases:
- Three-minute ramp to 200kW peak.
- Sustained high rate until about 50 per cent SOC.
- Smooth drop-off, staying strong past 75 per cent.
- Finished 80–100 per cent in just 16 minutes.
Expert’s view:
“The Volkswagen shows similar results to the Ford and they’re almost certainly using a very similar battery chemistry and management system. After a quick ramp up, there’s a dip near the beginning of the charge, but it then does a good job of staying over 100kW for a large proportion of the time.”
1
Key takeaways
Few EVs reach or sustain their advertised peak charging rates. Most averaged two-thirds or less of the claimed figure when adding 60 per cent capacity. Manufacturers often point to battery pre-conditioning as the missing step, but some cars achieved near-peak rates without it — suggesting that expectations should be tempered.
Charging above 80 per cent at public DC chargers rarely makes sense, as rates plunge dramatically. In real life, the charger is only half the story – your car’s software and battery design are the real gatekeepers of speed.
* Look-up table algorithm: In computer science, when a specific input is encountered, the algorithm directly retrieves the corresponding precomputed output from the table, rather than performing the calculation or executing the complex logic again.

We recommend
-
 Advice
How long does it take to charge an electric car?
It’s a common question that can be complex to answer. We break down the charging times and limitations
-
 News
News400km of charge in 5 minutes! BYD unveils new EV tech
BYD reveals new 1,000V platform it claims can add more than 400km of range in just five minutes.